⋔ home ⋔ about ⋔ links ⋔ license ⋔ archives ⋔ rss ⋔
1572 words by attila written on 2022-02-20, last edit: 2022-02-23, tags: bsd, cli, monitoring, shell, ttyplot, unix ⋔ Previous post: ksh Indicator Light ⋔ Next post: Christina Sharpe, 2016: Lose your kin
I live on the command line, in text mode, everything important is safely tucked away in tmux sessions on my laptop and various servers. As a result of this stubborn tendency I have naturally wasted a lot of time coming up with cool ksh hacks around ttyplot. I mean this is just science. Really. It's science. I mean, look at it.
It's in ports under OpenBSD and packaged for Void linux, so you can just install it as a binary package in the usual way. The basic idea is that it receives one or optionally two streams of numbers on stdin and it plots them. You can tell it the units to use, a few other things. It really does just do one thing well: no fancy features, including a couple I could use, but whatever.
This one seems easy at first glance (excerpt from my kshrc):
# ping rtt plot
pingplot () {
    local errfile="/tmp/$1.errs"
    ping $* 2>$errfile | sed -u "s/^.*time=//g; s/ ms//g" | \
        ttyplot -u ms -t "ping rtt: $*"
}
Key points:
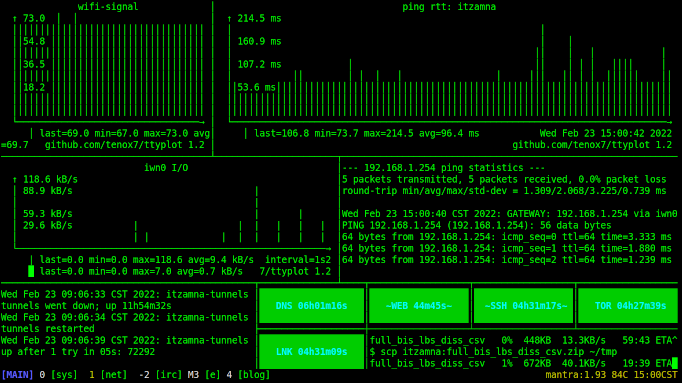
sed -u so ttyplot gets the data as it arrives.The plots it produces are informative, but they are especially so in
the here and now. I've dumped a few pictures of what this looks like
as a snapshot in time but that doesn't really get the effect across.
We live with a shite internet connection.
Frequently what happens is my pingplot pane (generally to NYI)
freezes when my pings don't come back, so I can just glance at my tmux
monitoring pane and see the chart isn't moving. These gaps in time are
in no way indicated in the chart, which makes the over-all chart a big
fat lie: it's really the concatenation of a series of charts that are
created when I have connectivity and die in the periods when I don't.
It would be interesting and cool to visualize this better, but I'm really just sort of beligerently stitching together and reacting to the craziness of our situation with minimum-energy BSD unix-style moves here, that's all. Screw grapics and the web, I'm doing alright with the pig-lizard this way.
One way to make the chart more meaningful over time is to try a little harder to guarantee the production of a data-point every so-often... something like this:
# ping rtt plot, second version: $ pingplot2 target [null-value]
# produce a tick at least every 5 seconds no matter what
# if there is no data spits out null-value, default=0
pingplot2 () {
    local host=$1 errfile="/tmp/$1.errs"
    shift
    local null=0
    [ $# -gt 0 ] && {
        null=$1
        shift
    }
    local opts="$*"
    while true; do
        local val=$(ping -c 1 -w 5 $opts $host 2>$errfile | grep time= | sed -u "s/^.*time=//g; s/ ms//g")
        [ -z "$val" ] && {
            val=$null
        }
        echo $val
    done | ttyplot -u ms -t "ping rtt: $host"
}
So the right way to think about the null value is it should indicate that there is no real data in that timeslot; zero is not a bad choice, but e.g. if the max time we will wait is 5000ms and the chart y axis is labeled "ms" then we could make it 5001 or something. This affects the shape of the chart quite drastically, but moreover the whole "roughly 5 second" thing is both (a) a limitation of the underlying data gathering tool (ping) and its implementation of its stated timeouts and (b) juuust a little too long CLI UX-wise - I find myself staring too much at the chart to make sure it's still alive, unlike the other one which makes it very clear when it's not.
In practice I find second kind of chart less useful, since it doesn't really give me the at-a-glance-are-we-up-or-not? perspective I am expecting from my text-mode crash console. In order to make this better I would need to modify ping or roll my own ping-like thing in Perl... and that's definitely a bridge too far.
Another example of something this is good for: how busy is my laptop?
My fave answer is: $ vmplot interrupts
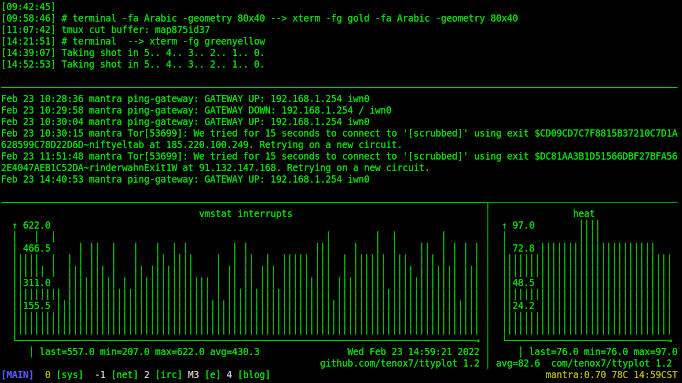
One-liners that I use all the time in this regard:
$ sysplot heat$ sysplot nprocs$ sysplot time_wait$ vmplot interrupts$ ifaceplotSeveral of those depend on helper scripts, which I won't bother
dumping because they're tiny and obvious: nprocs produces the total
number of processes on stdout, etc..
If we want a very detailed plot with a lot of resolution and high time-fidelity I think we're already well past the point this shit can take us. This is more just using the simple materials at hand (ttyplot has very few deps) and not sweating the details until they become important... and yeah, I would like a few more features once in a while but then the whole point of all of this is to give me a clue what I need to do on the command-line to deal with whatever is going wrong at the moment, so ultimately it's better to keep it simple, do one thing well and stay out of the way.
Plus there's always Nagios when I get tired of this and for real deployments that aren't rusting to death and failing in the salt air here with me I'm all about that.
Anyway, Here's all the loopy stuff I've done, FWIW. YMMV. A lot of it will only work on OpenBSD, I'm pretty sure.
##+ttyplot

# ping rtt plot
pingplot () {
    local errfile="/tmp/$1.errs"
    ping $* 2>$errfile | sed -u "s/^.*time=//g; s/ ms//g" | \
        ttyplot -u ms -t "ping rtt: $*"
}
# ping rtt plot, alt approach
pingplot2 () {
    local host=$1 errfile="/tmp/$1.errs"
    shift
    local null=0
    [ $# -gt 0 ] && {
        null=$1
        shift
    }
    local opts="$*"
    while true; do
        local val=$(ping -c 1 -w 5 $opts $host 2>$errfile | grep time= | sed -u "s/^.*time=//g; s/ ms//g")
        [ -z "$val" ] && {
            val=$null
        }
        echo $val
    done | ttyplot -u ms -t "ping rtt: $host"
}

# interface rate in/out composite plot
ifaceplot () {
    local iface
    [ $# -gt 0 ] && {
        iface=$1
        shift
    }
    [ -z "${iface}" ] && iface=$(gwif)
    while true; do
        systat -B -s 0.1 if | grep ^${iface} | perl -lane 'BEGIN {$|=1} print $F[3]/1024.0," ",$F[6]/1024.0'
        sleep 1
    done | ttyplot -2 -r -u kB/s -t "${iface} I/O"
}

# map column# in vmstat output -> symbolic name
vmcolnm () {
    local x=$1
    case $1 in
        0) x=runnable ;;
        1) x=sleeping ;;
        2) x=active ;;
        3) x=free ;;
        4) x=pagefaults ;;
        5) x=reclaims ;;
        6) x=pagein ;;
        7) x=pageout ;;
        8) x=pagefree ;;
        9) x=scanned ;;
        10) x=sd0 ;;
        11) x=cd0 ;;
        12) x=interrupts ;;
        13) x=syscalls ;;
        14) x=switches ;;
        15) x=user ;;
        16) x=system ;;
        17) x=idle ;;
    esac
    echo $x
}

# map symbolic name -> column in vmstat output
vmnmcol () {
    local x=$1
    case $1 in
        act*) x=2 ;;
        cd0|disk1) x=11 ;;
        free*) x=3 ;;
        id*) x=17 ;;
        int*) x=12 ;;
        run*) x=0 ;;
        pagefa*) x=4 ;;
        pagei*) x=6 ;;
        pageo*) x=7 ;;
        pagefr*) x=8 ;;
        re*) x=5 ;;
        sc*) x=9 ;;
        sd0|disk0) x=10 ;;
        sl*) x=1 ;;
        sw*) x=14 ;;
        sysc*) x=13 ;;
        syst*) x=16 ;;
        us*) x=15 ;;
    esac
    echo $x
}

# e.g. $ vmplot interrupts
vmplot () {
    local col vcol
    if [ $# -gt 0 ]; then
        col=$1
        shift
    else
        col=3
    fi
    vcol=$(vmnmcol $col)
    vmstat 1 | \
        perl -lane 'BEGIN {$|=1} $x=$F['$vcol']; $x=~s/M$//; print $x'|\
        ttyplot -t "vmstat $col"
}

# e.g. $ vm2plot pagefaults free
vm2plot () {
    local col0 col1 vcol0 vcol1
    if [ $# -gt 0 ]; then
        col0=$1
        shift
        if [ $# -gt 0 ]; then
            col1=$1
            shift
        else
            col1=14
        fi
    else
        col0=3
        col1=14
    fi
    vcol0=$(vmnmcol $col0)
    vcol1=$(vmnmcol $col1)
    vmstat 1 | \
        perl -lane 'BEGIN {$|=1} ($x,$y)=($F['$vcol0'],$F['$vcol1']); $x=~s/M$//; $y=~s/M$//; print "$x $y"' | \
        ttyplot -2 -t "vmstat $col0 vs. $col1"
}

# e.g. $ sysplot load
sysplot () {
    local what=$1 unitz=$2 title=$3
    [ -z "$what" ] && what=load
    [ -n "$unitz" ] && unitz="-u $unitz"
    [ -z "$title" ] && title="$what"
    while true; do
        ${what}
        sleep 1
    done | ttyplot ${unitz} -t $title
}

# e.g. $ sysplot interrupts pagefaults
sys2plot () {
    local what1=$1 what2=$2
    while true; do
        echo "$(${what1}) $(${what2})"
        sleep 1
    done | ttyplot -2 -t "$what1 vs $what2"
}

# e.g. $ sysctlplot nprocs
sysctlplot () {
    local what=$1
    case $what in
        kern.*) ;;
        *) what=kern.$what ;;
    esac
    while true; do
        sysctl -n $what
        sleep 1
    done | ttyplot -t $what
}

##-ttyplot
Copyright © 1999-2023 by attila <attila@haqistan.net>. All Rights Reserved.